On the Conservation of Snow Leopards


Alex and Jack Strang - March 22, 2020
You are working with a nature documentary crew looking for snow leopards. Four days in, the guides lead you to the top of a mountain pass dividing two valleys. Snow leopards are sometimes sighted using the pass to move between the valleys.
You carefully place your camera traps and return to camp. Weeks pass with no sightings. You place more camera traps on the other passes and wait. Days come and go but no leopards. Frustrated, you seek out the team’s conservationist. “How many leopards do you think are in this valley?”
“Two,” she says, “on average.”
“Not many for all this space,” you answer, looking out across the rugged miles that surround your mountain camp. You slip into the main tent to check the tapes. You are scrolling through the video feed when, at last, a snow leopard appears on the screen. It crossed the pass last night. It even paused to inspect the camera before moving on. Thrilled, you wake the team and replay the tape. Everyone celebrates. It was a long month waiting.
The conservationist is watching over your shoulder. You look up. “I guess there’s only one in the valley left to find.”
She shrugs. “I still think there’s two out here.”
“But we saw one leave. How can there still be two?”
She shrugs again and smiles. “Two,” she says, “on average.”
Introduction
This is an example of a problem in expectation. The actual number of snow leopards in the valley is unknown. But, on average, there are two leopards in the valley. The question is how this expected number should update after seeing a snow leopard leave the valley.
At first the answer seems obvious. Every time a leopard leaves the valley the total number of leopards in the valley decreases by one. So the expectation should decrease by one.
But should it?
Suppose that the expected number of leopards in the valley is instead of . When one leopard leaves the valley, the expected number of leopards remaining in the valley cannot be —there is no such thing as an anti-leopard. In this case it is obvious that we cannot update the expectation by subtracting one leopard from the expectation.
The subtlety here is in the distinction between expecting that there are a certain number of leopards in the valley and knowing the number. If we had counted all the leopards then we would know the number exactly. This number would match the expectation and would decrease by one when a leopard leaves. If we do not know the number of leopards for sure then the expectation is an average. Knowing the average number is not the same as knowing the actual number of leopards because it leaves the actual number uncertain. This uncertainty means that there is implicitly a probability distribution on the size of the leopard population.
For example, if the expected number of leopards is there is not actually half a leopard. There is no more a fractional leopard than an anti-leopard. It means that there is a nonzero probability that there are zero leopards, and a nonzero probability that there are one or more leopards.
Now we see a leopard leave. This would have been impossible if there were zero leopards in the valley, since leopards cannot appear from thin air. So there was at least one leopard in the valley. The observation event has taught us something: given that we a saw a leopard leave we should ignore the possibility that there had been zero leopards. As a result, the conditional expectation of the number of leopards in the valley before one left should always be greater than one. In turn the new expectation can never be negative.
Speaking more broadly, the more leopards in the valley the more likely it is to observe one leaving. Therefore, the observation event carries information about the number of leopards in the valley before the event. The fact we saw one leave means there could not have been zero—there may have been more than we thought. This means we should revise our old expectation upwards before subtracting the individual who left. The more uncertain we were before seeing a leopard leave the more we should revise upwards.
Revising the expectation upward before subtracting the wandering leopard is common sense in other contexts. For example, consider a fisherman who tries a new pond and has the most successful day of his fishing career. The fisherman is likely to return to the pond; since he caught fish there means there are (or at least were) fish in the pond. As long as he continues to catch fish, he is likely to return. Every catch is evidence that the pond contains fish, despite depleting the pond.
Here we formalize this problem to show how the expectation should be updated after observing a leopard leave. This requires introducing some notation and formalizing the relationship between the rate at which leopards leave the valley and the number of leopards in the valley.
Model
Let be the number of snow leopards in the valley at time . This is an example of a stochastic process since is a random variable for each . Let be the probability .
Then the expected number of leopards at time is:
Now we need a model for when snow leopards cross the pass.
Since snow leopards do not wear wrist-watches, and since all our efforts to speak to snow leopards have failed, the timing of each crossing is unpredictable so is best modeled as a random variable. This is an example of a counting process. Each time a leopard crosses the pass we count an additional crossing, but the timing of the crossings is random. In order to model the crossing we need to specify a probability distribution that returns a probability (or probability density) for any sequence of crossing times.
A natural way to construct such a distribution is to define an expected, or average, event rate, . If we let be the number of events that occur in the interval , then this usually means that:
Here represents any function of that converges to zero as goes to zero faster than . A function is if . Under these assumptions the expected number of events in any time interval is simply times the length of the time interval. This sort of counting process, a Poisson process, is widely used to model rare events. For example, this is the precise probabilistic description for the decay of radioactive material.
Suppose the rate $\lambda(X(t))$ is a constant in time. Then the process defined above is a time homogeneous Poisson process. A Poisson process is an example of a counting a process. A counting process is a stochastic process, $N(t)$, that represents the number of times an event has occurred between times $0$ and $t$. The time between events in a counting process are the waiting times. Let $W_j$ represent the time in between the $j^{th}$ and $j+1^{st}$ events. The event times $T_j = \sum_{i < j} W_i $ are the times at which the events occur.
A Poisson process is a counting process where the number of events in non-overlapping time intervals are independent of each other, and the probability that $n$ events occur in a given time interval depends only on the length of the time interval, not the time at the start of the interval, or the number of events that have occurred in the past. Counting processes that do not posses these properties are not Poisson. For example, the timing of water droplets from a leaky faucet is not a Poisson process, since the drops drop with a characteristic rhythm—they are more likely to occur during some time intervals than others, even if those intervals are of equal length. This is also not a Poisson process, since the number of drops during an interval is not independent of the number of drops that came before. If no drops dropped during the preceding interval, then it is more likely that a drop will drop during the current interval, since more water has built up on the faucet.
Poisson processes are the most widely used counting process models. Example applications of Poisson processes include queueing, systems of chemical reactions at the cellular scale, and population modeling with discrete birth and death events.
Here we provide four different characterizations of the Poisson process. These characterizations are minimal sets of assumptions about the counting process that guarantee it is Poisson. All four characterizations share the same $0^{th}$ assumption, which ensures the process is a counting process. Formally:
0. $N(0) = 0$, $\lim_{t \rightarrow \infty} N(t) = \infty $ with probability one, $N(t)$ is nondecreasing and right continuous: $ \lim_{s \rightarrow t^+} N(s) = N(t) $, and at the event times $N(t)$ increases by exactly one.
To ensure that a counting process is a Poisson process we need to introduce one of the following three assumptions. Combining one of these assumptions with assumption 0 ensures that a process is Poisson, and guarantees that the remaining assumptions are also true. 1 The assumptions are:
1. For $0 < t_1 < t_2 < ... $, the increments $N(t_1)-N(0), N(t_2) - N(t_1), ...$ are independent and the distribution of $N(t) - N(s)$ depends only on the width of the time interval $t - s$.
2. The waiting times $W_j$ are independent and exponentially distributed with parameter $\lambda$:
$$ \text{Pr}\{W_j = w\} = \lambda \exp(- \lambda t). $$
3. For $0 < t_1 < t_2 < ... $ the increments $N(t_1)-N(0), N(t_2) - N(t_1), ...$ are independent and are Poisson-distributed:
$$ \text{Pr}\{N(t) - N(s) = n\} = \frac{(\lambda(t-s))^n}{n!} \exp(-\lambda(t-s)). $$
Assumptions 2 and 3 are stronger than assumption 1. in that they are explicit assumptions about the distribution of either the waiting times or the increments.
Similarly, if assumption 0 is made, and $\text{Pr}\{N([t,t+\Delta t]\}$ matches the asymptotic behavior we used to define our counting process, then $X(t)$ is a Poisson process. The equivalence of assumptions 1, 2, 3, and the asymptotic form for $\text{Pr}\{N([t,t+\Delta t]\}$ under assumption 0 is partly why Poisson processes are widely used. Assumptions 0 and 1 are reasonable for many counting processes, and the asymptotic form for $\text{Pr}\{N([t,t+\Delta t]\}$ is the most natural interpretation of a counting process where events occur at an average rate $\lambda$.
What remains is to specify , the rate at which we expect to see leopards leave the valley if there are leopards in the valley. It is reasonable to assume that this rate increases the more snow leopards there are in the valley. Note that the actual dependence of on depends on how leopards interact while dispersing. A highly social animal is likely to stay near other members of its species, so the rate at which any individual leaves a group may decrease the more individuals are in the group. In this case will be sublinear (not proportional to ), and may even decrease in for large enough . Territorial animals may actively avoid each other while dispersing, hence may be superlinear in . In general it is only possible to address the question, “How many do you think are out there now?,” once is specified. Here we give the solution for a particular , and provide details on the general case as supplement.
Under most migration models it is reasonable to assume that the rate is proportional to . This is often assumed for one of two reasons:
- Linear models are easy to treat analytically and often give sufficiently good approximations when does not vary greatly.
- Linear models match physical systems in which individuals disperse independently of one another.
Both of the reasons are in play here. It is always better to start with a tractable model in order to understand the fundamental components of a problem. Moreover the ubiquity of linear transition rates in applications makes linear rates an important test case. Finally, snow leopards are famously solitary animals—“the only prolonged social contact in snow leopards is that of a female and her dependent offspring . . . no evidence was found to substantiate territoriality”2—so it is not unreasonable to start by modeling their dispersal as independent.
If each individual disperses independently of the other individuals, then:
for some per capita rate . The per capita (per individual) rate is simply the rate at which any individual is expected to leave the valley.
.
We are now equipped to state the question formally.
Problem
Suppose that the transition rate is linear in the number of leopards in the valley, the expected number of leopards in the valley before observing one leave is , and one is observed leaving. What is the new expectation?
Solution
If the expected number of leopards in the valley before the event was , and the variance in the number of leopards in the valley before the event is , then the expected number after the event is .
Proof
The proof is organized as follows. First we show that if a sufficiently small time window is chosen around the event time, then it can be assumed that only one event occurs during the time window. We then use the asymptotic form for the probability that one event occurred during the window to compute the conditional probability that there were leopards in the valley. We then average over this distribution to compute the expected number of leopards in the valley after one is seen leaving.
The joint probability that two events occur is the probability they both occur. For example, the probability that a randomly drawn American is male and over 6 feet tall is the joint probability of the event that the American is male, and the event that the American is $6$ feet tall. Joint probability is indicated with the intersection sign $\cap$. The $\cap$ can be read as "and":
$$\text{Pr}\{\text{male and over six feet} \} = \text{Pr}\{\text{male} \cap \text{over six feet}\}.$$
Conditional probability is the probability an event occurs given that another has occurred. For example, the probability an American man is over $6$ feet tall is the conditional probability that an American is over six feet tall given that they are male. Conditional probability is denoted with a vertical bar $|$. The vertical bar, $|$, can be read as "given that":
$$\text{Pr}\{\text{over six feet given male} \} = \text{Pr}\{\text{over six feet}|\text{male}\}.$$
Joint and conditional probabilities are related by the fact that the probability that two events occur, $A$ and $B$, is the probability $B$ occurs given $A$ occurs times the probability $A$ occurs:
$$\text{Pr}\{A \cap B\} = \text{Pr}\{B|A\} \text{Pr}\{A\}.$$
In our example, 14.5 percent of American men are over 6 feet and 49.2 percent of Americans are male. Therefore:
$$\text{Pr}\{\text{male} \cap \text{over six feet}\} = \text{Pr}\{\text{over six feet}|\text{male}\} \text{Pr}\{\text{male}\} = 0.145\times 0.492 = 0.071.$$
This equation can also be used to solve for conditional probabilities from joint probabilities:
$$\text{Pr}\{B | A\} = \frac{\text{Pr}\{B\cap A\}}{\text{Pr}\{A\}}.$$
We use this relation to solve for the conditional probability there were $x$ leopards given that one was observed crossing the pass.
Suppose that an event occurs at time . Consider the time interval for small . By assumption, the probability that more than one event occurs in the interval is . We condition on at least one such event occurring. The probability of at least one event occurring is proportional to . This means that the probability of more than one event occurring, conditioned on an event occurring, is proportional to , which, by definition, converges to zero as goes to zero. Therefore, for sufficiently small we can assume that only one transition event occurred in the time interval.
Since one event occurred during the interval, is the conditional probability:
Or, equivalently:
That is, the probability there are leopards in the valley after seeing the event is the probability that there were leopards in the valley before seeing the event, given that an event occurred. To compute this conditional probability we will use Bayes’ rule.
Bayes’ rule is a method for computing the conditional probability of an event based on observations of a different, but related, event. For example, suppose that you and I play a game of dice in which the high roller wins. Given that you win, what is the probability that you rolled a five?
Let’s first find the joint probability that you rolled a five and won. The probability that you rolled a five is $1/6$. The probability that you won with a five is $4/6$, since you cannot have won if I rolled a five or six. Therefore, the joint probability is:
$$ \text{Pr}\{\text{win} \cap \text{rolled a 5}\} = \text{Pr}\{\text{win} | \text{rolled a 5}\} \text{Pr}\{\text{rolled a 5}\} = \frac{4}{6} \times \frac{1}{6} = \frac{4}{36} $$
Here we have computed the joint probability in the direction of causality. There is a probability you rolled a five; given that you rolled a five, there is another probability that you won. Bayes’ rule works by going against causality. It is equally true that:
$$ \text{Pr}\{\text{win} \cap \text{rolled a 5}\} = \text{Pr}\{\text{rolled a 5} | \text{win}\} \text{Pr}\{\text{win}\} $$
Notice that $ \text{Pr}\{\text{rolled a 5} | \text{win}\} $ is the conditional probability we were originally looking for. Thus, if we divide across by the probability that you win, we get:
$$ \text{Pr}\{\text{rolled a 5} | \text{win}\} = \frac{\text{Pr}\{\text{win} \cap \text{rolled a 5}\}}{\text{Pr}\{\text{win}\}}. $$
We can then substitute in our original expression for the joint probability that appears in the numerator:
$$ \text{Pr}\{\text{rolled a 5} | \text{win}\} = \frac{\text{Pr}\{\text{win} | \text{rolled a 5}\} \text{Pr}\{\text{rolled a 5}\}}{\text{Pr}\{\text{win}\}} $$
This gives the conditional probability going backwards in terms of the conditional probability going forwards. We already know what the numerator is because we know the conditional probability going forwards: $4/36$.
To compute the denominator, you have to find the overall probability that you win, which is: [the probability you win and rolled a $1 $] $+$ [the probability you win and rolled a $2 $] $+$ [the probability you win and rolled a $3 $], and so on up to $6$. In mathematical terms:
$$ \begin{aligned} \text{Pr}\{\text{win} \} & = \sum_{x = 1}^{6} \text{Pr}\{\text{win} \cap \text{rolled a } x\} \\ & = \sum_{x = 1}^{6} \text{Pr}\{\text{win} | \text{rolled a } x\} \text{Pr}\{\text{rolled a } x\} \\ & = \sum_{x = 1}^{6} \frac{(x - 1)}{6} \frac{1}{6} = \frac{0 + 1 + 2 + 3 + 4 + 5}{36} = \frac{15}{36}. \end{aligned} $$
Putting it all together:
$$ \text{Pr}\{\text{rolled a 5} | \text{win}\} = \frac{\text{Pr}\{\text{win} | \text{rolled a 5}\} \text{Pr}\{\text{rolled a 5}\}}{\text{Pr}\{\text{win}\}} = \frac{4/36}{15/36} = \frac{4}{15}. $$
Note that the probability you rolled a five given that you won, $4/15$, is greater than the probability of rolling a five, $1/6$. This is because you are more likely to win if you roll a large number. Knowing that you won suggests you rolled a high number.
We will use this same technique to compute the conditional probability that there were $ x $ leopards in the valley given that one left from the conditional probability that one leaves if there were $ x $ leopards in the valley. For another example of Bayes’ rule in action check out our article on baseball .
Now, using the fact that :
To compute the joint probability that there were leopards in the valley and one left, we use .
The probability is by definition. If then the probability one event occurred in the interval is . Therefore:
This joint probability is the numerator in the conditional probability we are solving for.
For the denominator we need the probability that one leopard left. To do this, sum the expression given above over all possible :
Then, substituting the numerator and denominator in and simplifying:
To finish, take the limit as goes to zero:
This is the probability that there are leopards in the valley given that one left the valley at time . Here represents an infinitesimally small time step and is retained to distinguish times immediately preceding and immediately following the transition event.
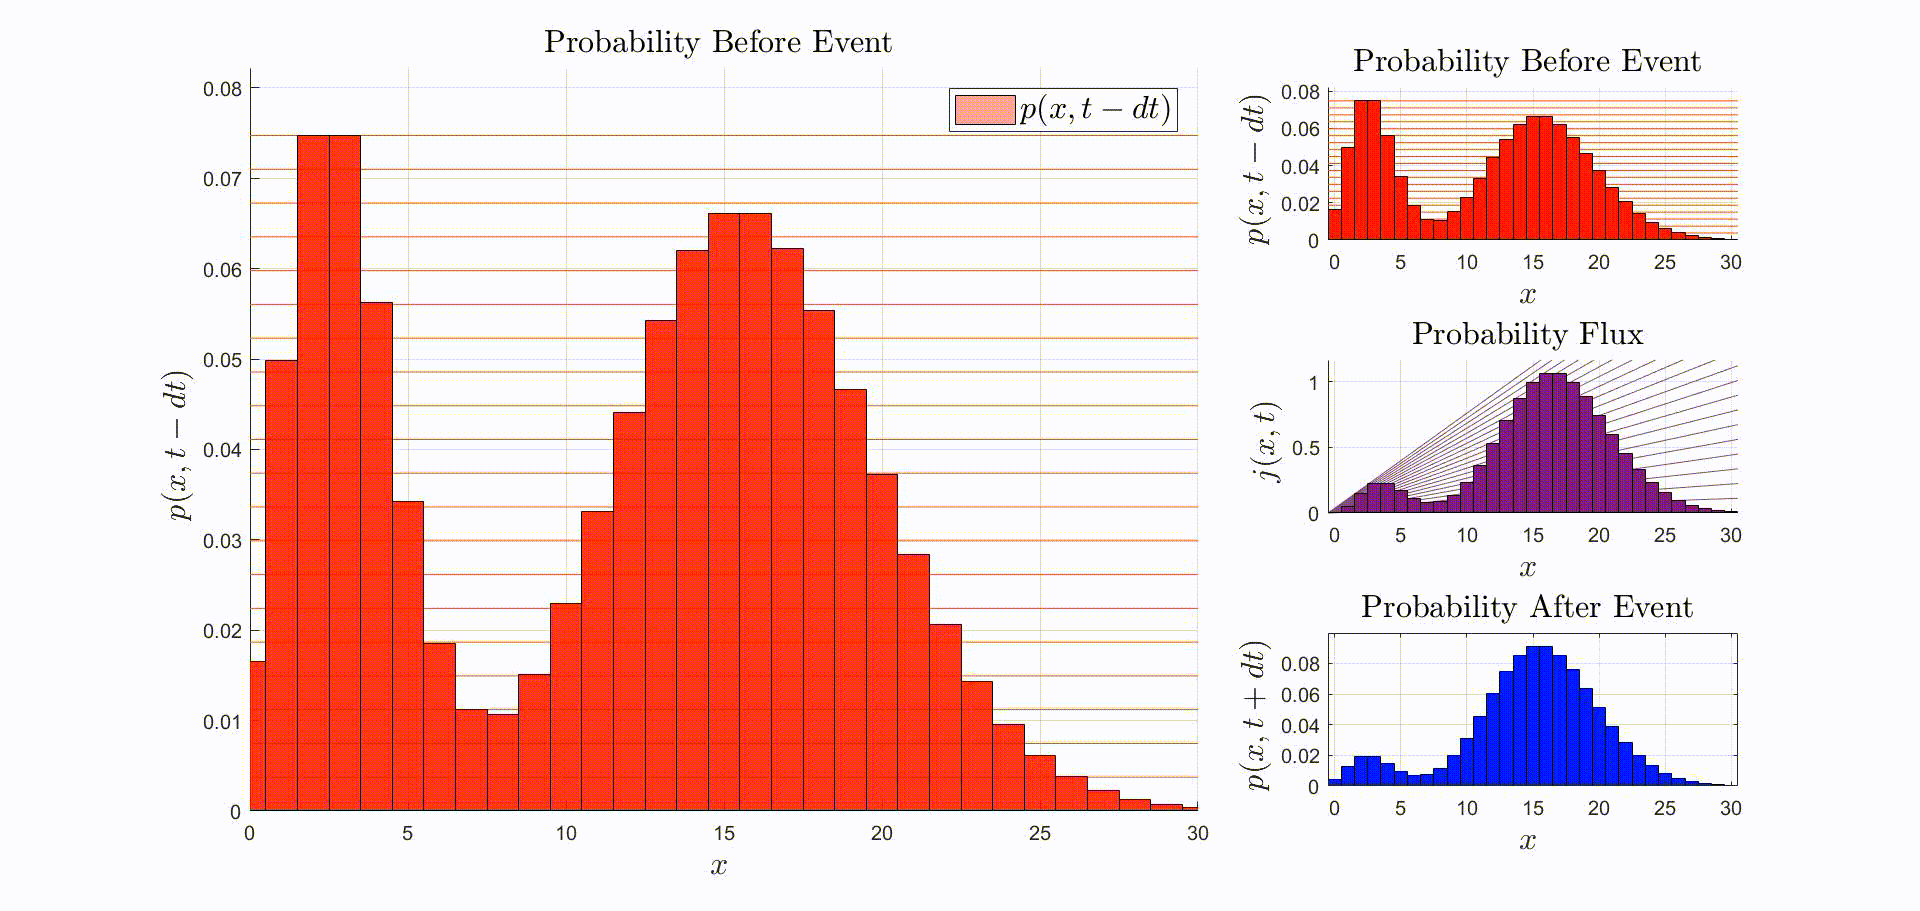
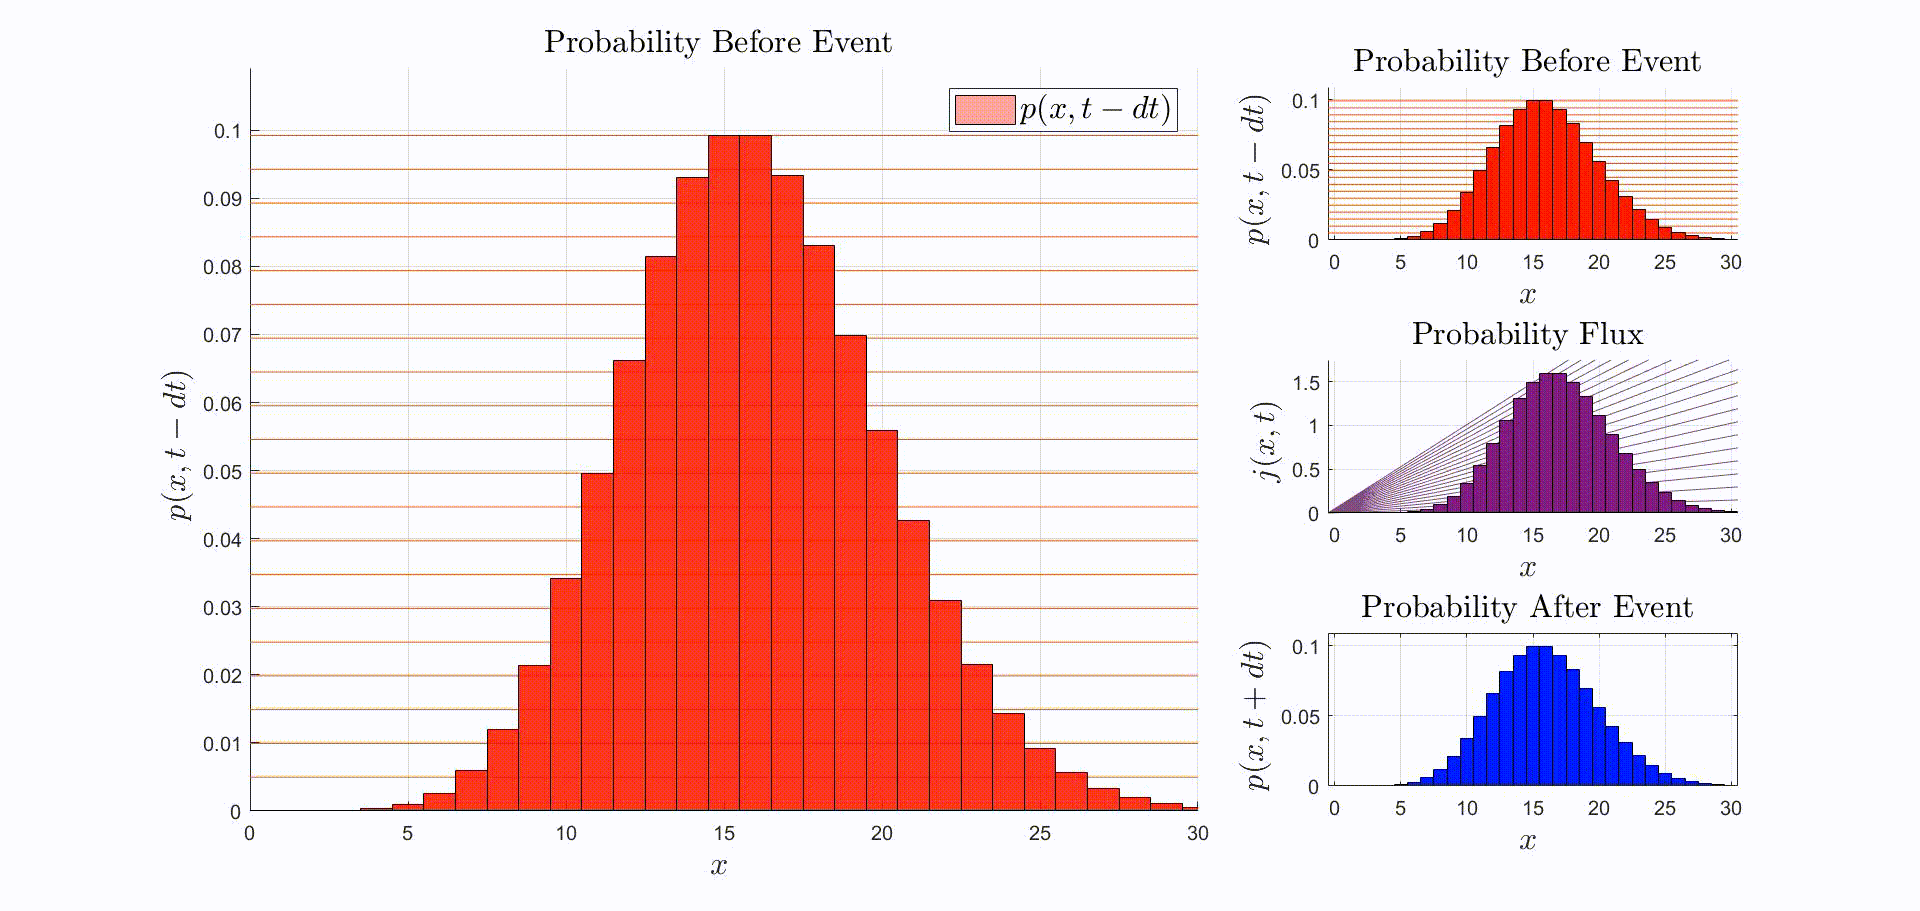
A convenient way to think about this equation is that is the rate at which probability flows out of the state: [there were leopards at time ], and into the state: [there are now leopards at time ]. The rate of a probability flow is a probability flux, . The product is the probability flux . Therefore, is proportional to the distribution of probability fluxes , normalized by and shifted down by one. The animation below shows the initial distribution of leopards transforming into the probability fluxes and then scaling and shifting to recover the distribution after the leopard left, .
Now that we have the probability given that an event occurred at time we can compute the new expectation:
Substituting in for in terms of the old distribution:
Let . Then:
To simplify the equation note that the expected value of a random variable squared is the same as the variance in the random variable plus the expected value of the random variable squared.
$$ \begin{aligned} \mathbb{E}[X^2] & = \mathbb{E}[(X - \bar{x} + \bar{x})^2] = \mathbb{E}[(X - \bar{x})^2 + 2 (X - \bar{x})\bar{x} + \bar{x}^2] \\ & = \mathbb{E}[(X - \bar{x})^2] + 2 \mathbb{E}[X - \bar{x}]\bar{x} + \bar{x}^2 \\ & = \mathbb{E}[(X - \bar{x})^2] + 2 (\bar{x} - \bar{x})\bar{x} + \bar{x}^2 \\ & = \mathbb{E}[(X - \bar{x})^2] + 0 + \bar{x}^2 \\ & = v + \bar{x}^2. \end{aligned} $$
Thus, the expected value of $X$ squared equals the variance plus the mean squared.
Let denote the variance in . Then . Therefore:
Discussion
This equation is easy to interpret. The new expectation is the old expectation minus one leopard, since we saw a leopard leave, plus our uncertainty in the number of leopards. We add the uncertainty because seeing a leopard leave is evidence that there may have been more leopards in the valley than we’d thought. Notice that if we had no uncertainty, then we knew the number of leopards in the valley, so the new expectation is just the old expectation minus one.
Here uncertainty is measured in the variance divided by the mean. This is the coefficient of variation (CV). The CV is a natural measure of uncertainty in this context, since it is a measure of the uncertainty relative to the mean. If we think leopards are rare, then the mean is small, and if we are very uncertain about the number of leopards, then the variance is large. This is precisely the case when observing a leopard should change our expectation the most. Accordingly the CV is largest when we expect leopards to be rare, but we are very uncertain about the number of leopards. This occurs when the distribution is skewed positive.
So who was right? Our fictional (idealized wilderness) self or the conservationist?
It depends on the coefficient of variation. If the conservationist knew the CV then she could answer exactly. The CV could be known empirically (by studying the population of leopards in many valleys), or could be computed if it is assumed that leopards are distributed according to a one-parameter family of distributions.
Sticking to our modeling approach, let’s see what happens if we pick a distribution. The natural first choice is a Poisson distribution, since many rare items are Poisson-distributed.
The Poisson distribution is the standard distribution used for modeling rare events and the occurrence of rare items. This is a consequence of the law of rare events, or Prekopa’s theorem. Prekopa’s theorem states that, if a counting process $X(t)$ has independent increments, $ X(t_4) - X(t_3) $ is independent of $ X(t_2) - X(t_1) $ for $t_1 < t_2 \leq t_3 < t_4$, and the probability that an event occurs at exactly time $t$ is zero for all $t$, then the increments, $N([s,t]) = X(t) - X(s) $, are Poisson-distributed. For this reason the number of rare events occurring in a time interval are often Poisson-distributed 1 .
In this case we are modeling the number of leopards in a valley, which is not naturally described as a number of events occurring during a time interval. The Poisson distribution is still appropriate for this modeling problem, since the generic steady state distribution for a birth-death process is a product of Poisson distributions. 3
A birth-death process is a stochastic process where birth and death events are modeled as time inhomogeneous Poisson processes whose rates depend on the number of leopards in the valley. This is exactly the type of model we used for the emigration events.

Suppose that the leopards are Poisson-distributed at time with mean . This means that:
Remarkably, the Poisson distribution has variance equal to its mean.
To compute the variance in the Poisson distribution start by computing its second moment:
The variance of a distribution is its second moment minus the mean squared so:
$$ v = \mathbb{E}[(X - \bar{x})^2] = \mathbb{E}[X^2] - \bar{x}^2 = \bar{x}^2 + \bar{x} - \bar{x}^2. $$
Cancelling the repeated $\bar{x}^2$ leaves:
$$ v = \bar{x}. $$
Since the coefficient of variation is the variance divided by the mean, the CV of the Poisson distribution equals . But then:
The expected number of leopards after observing one leave is the same as the expected number before seeing one leave!
Even more provocatively, no matter how many times we see a leopard leave, our expectation does not change. That is, Poisson-distributed leopards are conserved in expectation.
We can go further. Not only the expectation stays the same. If is a Poisson distribution then is also Poisson and . In this case not only is the expectation conserved, the entire distribution is conserved! Hence the observation event carries no information about the number of leopards in the valley. This is illustrated by the animation below.
Suppose that the immediately before the reaction the leopards are Poisson-distributed. Then, immediately after observing a leopard leave:
$$ \begin{aligned} p(x,t+dt) & = \frac{(x+1)p(x+1,t-dt)}{\bar{x}(t-dt)} = \frac{x+1}{\bar{x}(t-dt)} \frac{\bar{x}(t-dt)^{x+1}}{(x+1)!} \exp(-\bar{x}(t-dt)) \\ & = \frac{\bar{x}(t-dt)^x}{x!} \exp(-\bar{x}(t-dt)) = p(x,t-dt). \end{aligned} $$
This means that if the leopards are Poisson-distributed before one is observed leaving, the distribution of leopards after observing one leave is unchanged.
In this case the conservationist has made the most consistent prediction. The expected number of leopards should stay the same even though one was observed leaving.
What about the expected number of leopards in the neighboring valley? If the expected number in our valley stayed the same surely the expected number in the neighboring valley does as well?
This is not true. The expected number of leopards in the neighboring valley increases by one, exactly as we might have thought before doing all this math. How is that possible? The expected number in the neighboring valley increases by one, since the rate at which leopards enter a valley is independent of the number of leopards in that valley. It follows that seeing a leopard enter a valley tells us nothing about the number in the valley before the observation event. So all we need to do is add the new leopard to our previous expectation.
This is the key idea. When modifying an expectation to account for an observed event we need to ask: does the observation convey information about our original expectation? If it does, then we modify our old expectation before subtracting or adding the number of leopards entering or leaving. If it doesn’t, then there is no need to revise our expectation.
So, while the expected number of leopards in our valley is conserved the total number of expected leopards is not. Instead it increases by one every time we see a leopard walk out of our valley. An expected leopard has, in fact, entered the pair of valleys directly from the probabilistic ether!
Where did the extra expected leopard come from? How are we spontaneously producing an expected leopard?
The extra leopard was in plain sight all along. He was hidden in the possibility that there were more leopards than $\bar{x}(t-dt)$. When a transition event is observed this probability becomes the probability that there are more than $\bar{x} - 1$ leopards, which is the probability responsible for making $\bar{x}(t+dt)$ greater than $\bar{x}(t-dt) - 1$.
The sudden appearance of a new expected leopard seems strange, since it violates our intuition about the conservation of expectation. A leopard leaving a valley does not change the total number of leopards in the two valleys, but, with these assumptions, the expected number of leopards increases every time we see a leopard move between valleys. Taken in isolation this would mean that seeing the same leopard walk back and forth between the valleys would make our expected total number increase and increase and increase. That is obviously wrong.
The natural balance to this effect is that not seeing leopards is evidence that we should decrease our expectation. After all, if our hypothetical film crew waited a year, then they would conclude that leopards are rare, and if they had to wait a decade, then they might conclude that leopards are (at least locally) extinct. In general, the expected number of leopards should decay continuously in between observation events. Using the same modeling framework it is possible to show that this is, in fact, the case. Moreover, the rate at which the expectation decays between events balances the increase in expectation after each observation event.
Let’s put it all together. While we are waiting to see a leopard our expectation decays slowly. When we finally see one leave our valley we keep the expected number in our valley the same, but add a leopard to the expected number in the neighboring valley. On the other hand, if we see one enter our valley then we keep the expected number in the neighboring valley the same, and increase the expected number in our valley by one. Then we wait again. On the whole the process will keep our expectation near the true number of leopards. This is illustrated in the animation below.
A Little More
We provided the specific solution to the problem for a Poisson distribution above. While this is, arguably, the most relevant distribution for the discussion it is not the only distribution we could have picked.
Suppose that the leopards are geometrically distributed. This is the maximum entropy distribution supported on the natural numbers with mean $\bar{x}$, so it is the choice of distribution that incorporates the least side information about the distribution of leopards. The variance of the geometric distribution is equal to the mean squared minus the mean. Thus the CV of a geometric distribution is equal to the mean minus one. Now the expected number after observing a leopard leave is twice the original expectation minus one. This gives the update rule $\bar{x}(t+dt) = 2(\bar{x}(t-dt)-1)$ The geometric distribution is highly skewed, hence the expected number after observing an individual leave nearly doubles!
All of the examples given so far are distributions with large variances. Large variance leads to large corrections to the expectation before subtracting off the vagrant leopard. In contrast, what would be the smallest possible correction to the expectation? This is the same as asking, what is the smallest the variance could possibly be given the mean?
It can be proved that, for any random variable supported on the integers with a given mean, there is a unique distribution with minimal variance supported on the integers with the corresponding mean. This distribution is nonzero only on the two integers given by rounding the mean down and rounding the mean up. The variance in this distribution is given by the distance from the mean to the mean rounded down times the distance from the mean to the mean rounded up.
This gives the update rule:
$$\bar{x}(t+dt) = \bar{x}(t-dt) - 1 + \frac{\left(\lceil\bar{x}(t-dt)\rceil - \bar{x}(t-dt) \right)\left(\bar{x}(t-dt) - \lfloor \bar{x}(t-dt) \rfloor \right)}{\bar{x}(t-dt)} $$
Note that this update rule keeps the corrections due to the uncertainty small (less than 0.25 divided by the mean). Also notice that if the mean is between zero and one this automatically sets the new expectation to zero. The minimum variance distribution for mean between zero and one assumes that the only possibilities are that there were either zero or one leopard before the transition was observed. Since the transition could not have been observed if there were zero leopards, there had to have been one in the valley originally, and it was seen leaving, so there are now zero.
Consider general $ \lambda(x) $ (not necessarily linear). Then, repeating the same calculation, the distribution after observing an event is:
$$ p(x,t+dt) = \frac{\lambda(x+1)p(x+1,t-dt)}{\bar{\lambda}(t-dt)} $$
where $\bar{\lambda}(t) = \mathbb{E}[\lambda(X(t))] $.
Then:
$$ \begin{aligned} \bar{x}(t+dt) & = \frac{1}{\bar{\lambda}(t-dt)}\sum_{x=0}^{\infty} x \lambda(x+1) p(x+1,t-dt) \\ & = \frac{1}{\bar{\lambda}(t-dt)}\sum_{y=1}^{\infty} (y-1) \lambda(y) p(y,t-dt) \\ & = \frac{1}{\bar{\lambda}(t-dt)}\sum_{y=0}^{\infty} (y-1) \lambda(y) p(y,t-dt) \\ & = \frac{1}{\bar{\lambda}(t-dt)} \left(\mathbb{E}[X(t-dt) \lambda(X(t-dt))] - \bar{\lambda}(t-dt) \right) \\ & = \frac{1}{\bar{\lambda}(t-dt)} \mathbb{E}[X(t-dt) \lambda(X(t-dt))] - 1. \end{aligned} $$
To simplify note that:
$$ \mathbb{E}[X(t-dt) \lambda(X(t-dt))] = \mathbb{E}[X(t-dt) (\lambda(X(t-dt)) - \bar{\lambda}(t-dt))] + \bar{\lambda}(t-dt) \bar{x}(t-dt) $$
and:
$$ \begin{aligned} & \mathbb{E}[X(t-dt) (\lambda(X(t-dt)) - \bar{\lambda}(t-dt))] \\ & = \mathbb{E}[(X(t-dt) - \bar{x}(t-dt)) (\lambda(X(t-dt)) - \bar{\lambda}(t-dt))] \\ & = \text{cov}[X(t-dt),\lambda(X(t-dt))]. \end{aligned} $$
Substituting in yields the general solution:
$$ \bar{x}(t+dt) = \bar{x}(t-dt) - 1 + \frac{\text{cov}[X(t-dt),\lambda(X(t-dt))]}{\bar{\lambda}(t-dt)}. $$
This recovers our original solution when $\lambda(x)$ is linear, since then the covariance is proportional to the variance in $x$. Also notice that this solution is invariant under scaling $\lambda(x)$ by any constant. This means that the way the expectation changes depends only on how $\lambda(x)$ scales in $x$, not the actual rate. Finally, notice that if $X$ is positively correlated with $\lambda(X)$ then observing an event increases our expectation before a leopard is removed, while if $X$ and $\lambda(X)$ are negatively correlated then it decreases our expectation.
In all seriousness
This problem was motivated by a study of chemical signaling at the cellular scale. Cells signal each other by releasing signaling molecules, which diffuse through the inter-cellular medium and bind to receptors on other cells. The rate at which the receptors bind to the signaling molecule is proportional to the number of signaling molecules. The receptors play the same role as the camera traps in the previous examples. The signal released by the transmitting cell is encoded in the number of signaling molecules. The receiving cell receives this signal indirectly through observation events (i.e., binding events at receptors). How well could a receiving cell estimate the number of signaling molecules in solution based on occasional observations of binding events?
The example provided here shows that when the rate of observable events depends on the state of a hidden variable, observing an event carries information about the hidden variable, which should influence our expectation about the hidden variable.
More on Filming Leopards
Planet Earth II Documentary on Filming Leopards
-
Billingsley, Patrick. Probability and measure. John Wiley & Sons, 2008. pp. 297-307.
↩ -
Jackson, Rodney Malcolm. Home range, movements and habitat use of snow leopard(Uncia uncia) in Nepal. PhD diss., University of London, 1996. pp. 135 - 136
↩ -
Anderson, David F., and Thomas G. Kurtz. Stochastic analysis of biochemical systems. Vol. 1. Berlin: Springer, 2015. pp. 36
↩